

heliaProfiler bg mobile
heliaProfiler bg desktopheliaProfiler visual desktop scaled

heliaPROFILER Cycle-Accurate Profiling for Edge AI

Profiling Built for Ambiq AI

heliaProfiler kv mobile

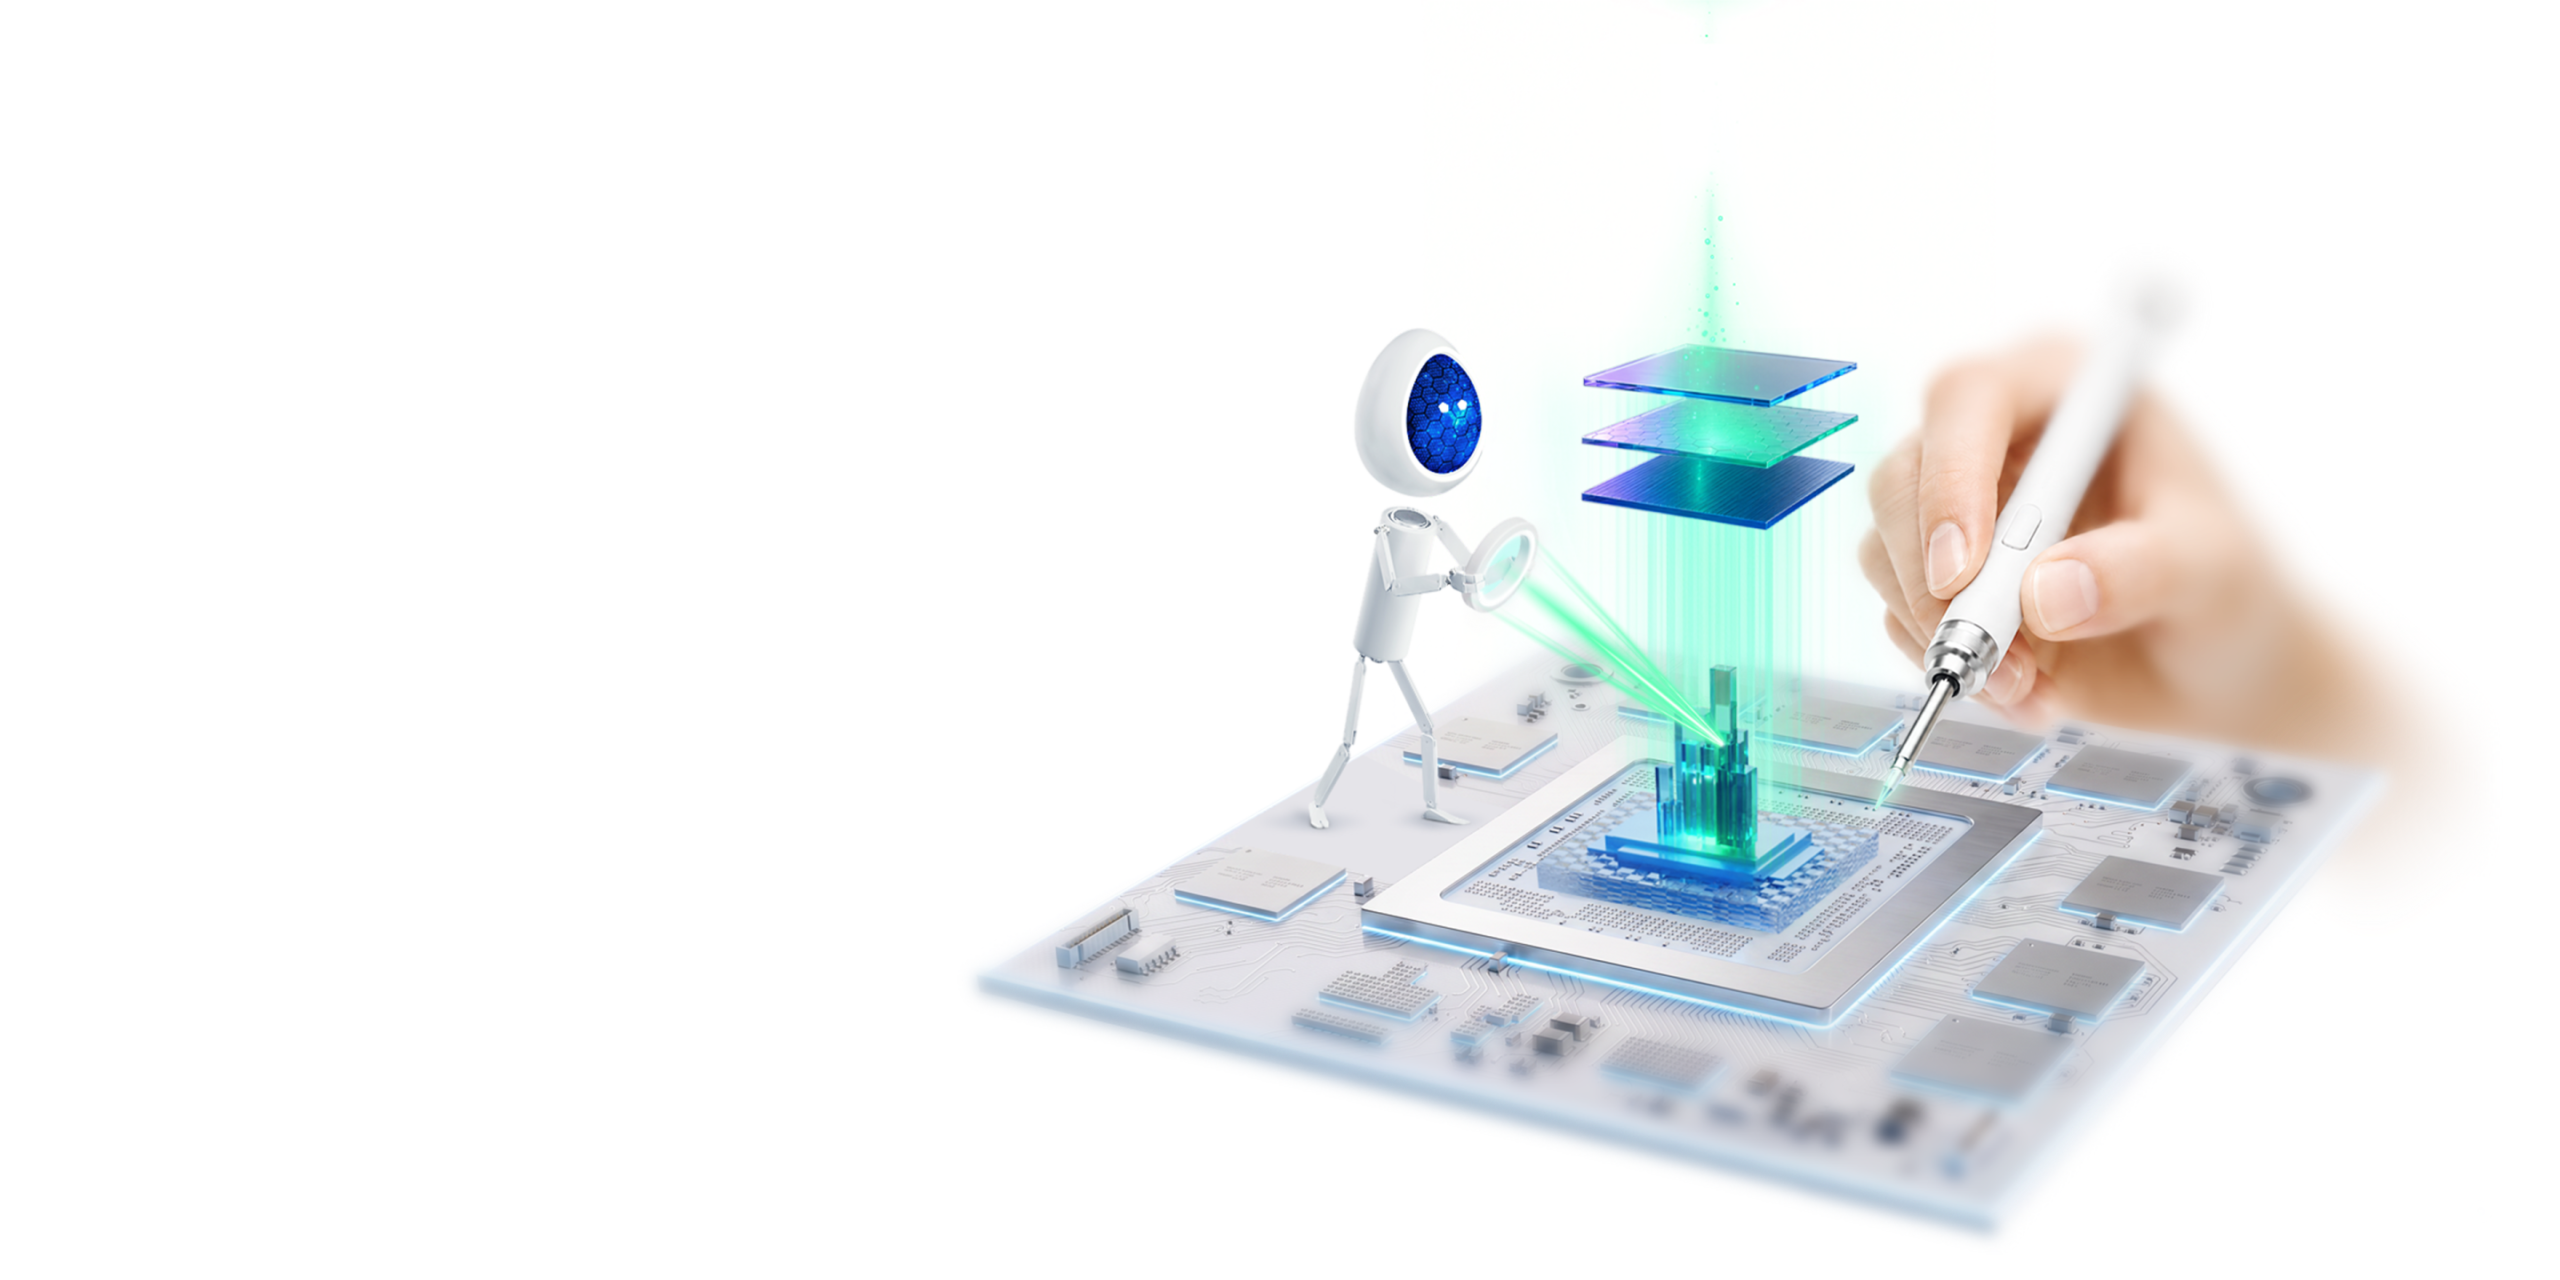
heliaPROFILER™ is Ambiq’s open-source profiling tool for the HELIA™ AI ecosystem, providing developers with cycle-accurate insight into AI model execution on Apollo SoCs. A single command builds, flashes, and reports on performance, memory, and energy efficiency, helping teams optimize edge AI models more quickly.

01

Choice of Execution Engine

Profile the same model against standard TFLM, heliaRT™, or heliaAOT™ through the same workflow, making it easy to see exactly how much Ambiq’s optimized runtime and compiler improve on the baseline.

02

End-to-End Automated Profiling

heliaPROFILER runs the full pipeline, build, flash, capture, and report, from a single hpx profile command, replacing fragmented manual.

03

Compiler and Toolchain Flexibility

heliaPROFILER supports GCC, Arm Compiler for Embedded (ACfE), and Arm Toolchain for Embedded (ATfE), letting developers compare toolchain configurations through a consistent workflow.

04

Power and Energy Per Inference

Optional Joulescope integration measures power and energy consumption on a per-inference basis, giving developers a direct way to evaluate energy efficiency and battery-life tradeoffs.

Optimization at Every Stage

heliaPROFILER supports the full Apollo platform, from Apollo 3 and 4 with DWT cycle counts to full Armv8-M PMU access on Apollo510. YAML-based configs make profiling runs reproducible, memory placement is configurable per run, and built-in result comparison catches regressions in CI/CD pipelines, so profiling supports your workflow from development through deployment. Per-layer metrics also export as JSON overlays for Google’s Model Explorer, making it easy to spot hot operators at a glance.

Design Resources

heliaPROFILER Developer Hub – Explore step-by-step guides, hands-on examples, and performance benchmarks to kickstart heliaPROFILER integration.
Ambiq AI Hub – Dive into neuralSPOT® AI SDK & toolkit and our heartKIT, sleepKIT, and soundKIT ADKs

Additional Documentation

  • Set favorites
  • Get update notifications
  • Use search filters

Video Library

hqdefault
hqdefault
hqdefault

FAQs

  • heliaPROFILER™ is Ambiq’s open-source profiling tool for AI models running on Apollo SoCs. It gives developers cycle-accurate visibility into how a model actually executes on hardware, covering cycle counts, instruction counts, cache stats, and per-layer PMU breakdowns, all from one command. 

  • Profiling AI workloads on embedded hardware has typically meant fragmented tools and manual analysis, which slows optimization work down. heliaPROFILER™ consolidates that process into a single automated workflow so developers can identify bottlenecks and compare optimization strategies without piecing together their own tooling. 

  • Teams building edge AI often can’t tell whether a performance issue lives in the model, the runtime, the compiler, or the hardware without significant manual instrumentation. heliaPROFILER™ answers that question directly by profiling standard TFLM alongside heliaRT™ and heliaAOT™ through the same workflow, so developers can see precisely where Ambiq’s optimizations gain ground and spend their time optimizing instead of building profiling infrastructure. 

  • It means heliaPROFILER™ measures what actually happens on the chip during execution, not an estimate. Using PMU counters on Apollo510 and DWT cycle counts on earlier Apollo hardware, it reports the real number of cycles, instructions, and cache events a model consumes, layer by layer. 

  • heliaRT™ and heliaAOT™ are two ways to run AI inference on Ambiq hardware, one as a runtime interpreter and one as an ahead-of-time compiler. heliaPROFILER™ doesn’t run inference itself, it measures how a model performs under standard TFLM, heliaRT, or heliaAOT, so developers can compare all three and choose the right path for their application.

  • Yes. heliaPROFILER™ includes built-in platform definitions for Apollo 3, 4, and 5, with full Armv8-M PMU access on Apollo510 and DWT-based cycle counts on Apollo 3 and 4. 

  • Yes. heliaPROFILER™ supports GCC, Arm Compiler for Embedded (ACfE), and Arm Toolchain for Embedded (ATfE), so developers can profile the same model across different toolchain configurations through a consistent workflow rather than rebuilding their setup for each comparison. 

  • With optional Joulescope integration, heliaPROFILER™ measures power and energy consumption on a per-inference basis rather than just raw current and voltage. That gives developers a direct, model-level view of energy cost, making it easier to evaluate battery-life tradeoffs during development instead of discovering them after deployment. 

  • No. YAML-based configuration makes profiling runs reproducible, memory placement is configurable per run, and built-in result comparison supports catching regressions in CI/CD pipelines. That makes heliaPROFILER™ a fit for ongoing optimization and regression testing throughout a project, not just an initial performance check.

  • heliaPROFILER™ is available now through Ambiq’s GitHub page. Documentation, getting-started guides, and the full command reference are available at the heliaPROFILER developer hub.

Preparing to download